
티스토리 뷰
COCO pre-trained YOLOv5, YOLOv8의 입력 이미지 사이즈와 COCO 데이터셋의 이미지 해상도
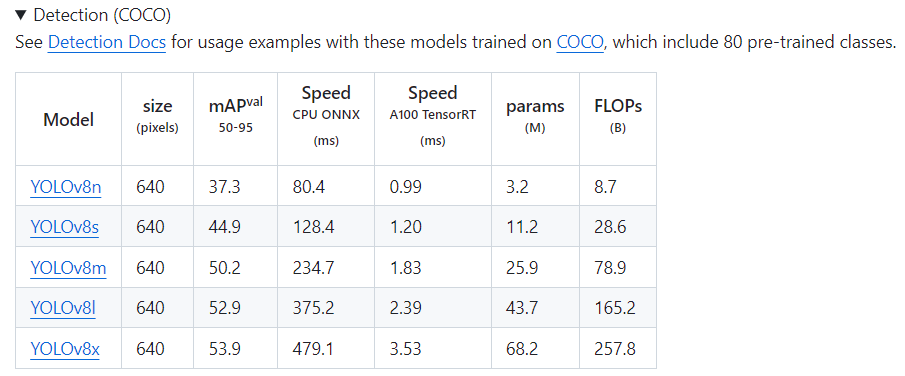
developer0hye 2024. 2. 12. 16:01COCO pre-trained YOLOv5, 8의 입력 이미지 사이즈는 대개 640x640으로 알려져있습니다. YOLOv5는 1280x1280 사이즈를 입력으로 받는 High mAP 지향형 모델도 있기는 합니다.

왜 640x640일까요?
우선 FPN 구조이자 입력 이미지가 모델 구조에 의해 32x Downsampling이 되기 때문에 입력 이미지의 해상도가 32의 배수여야 하는 제한이 있습니다. 그러고보면 640이 32의 배수인 걸 알 수 있습니다.
근데 32의 배수는 무수히 많은데 왜 640 일까요?
COCO 데이터셋의 해상도에 대한 통계치를 추출해보겠습니다. 2017년도에 구축된 데이터셋 기준입니다.
Train
#images: 118287
min h: 51, max h: 640, mean h: 484.09889506031936, median h: 480.0
min w: 59, max w: 640, mean w: 577.7120647239342, median w: 640.0


Val
#images: 5000
min h: 145, max h: 640, mean h: 483.543, median h: 480.0
min w: 200, max w: 640, mean w: 573.7548, median w: 640.0


Test
#images: 40670
min h: 75, max h: 640, mean h: 484.3245389722154, median h: 480.0
min w: 75, max w: 640, mean w: 577.0211212195721, median w: 640.0

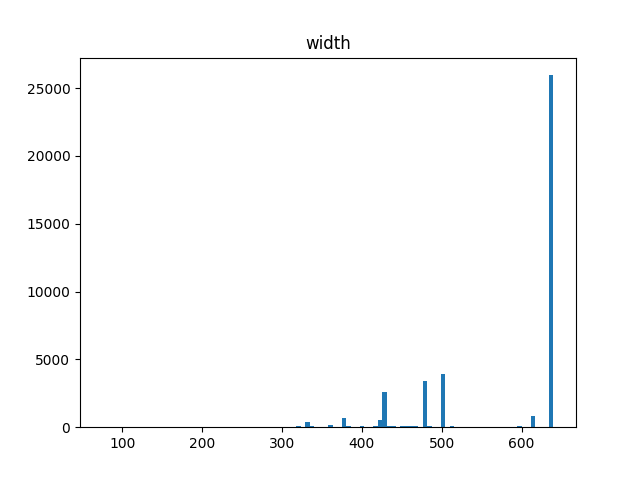
보시면, Train, Val, Test 셋 모두 이미지의 최대 높이, 너비 사이즈가 640인 걸 확인할 수 있고, 특히 너비 사이즈가 640인 이미지의 수가 많다는 것을 히스토그램을 통해 확인할 수 있습니다. 그러므로, 리사이즈와 관련된 어그먼테이션을 우선 제외하고 생각하면, 입력 이미지의 해상도를 640x640으로 설정하고 Aspect Ratio를 유지한채로 리사이즈를 하게 되면 정보의 손실이 없는 채로 리사이즈를 할 수 있게 됩니다. 그렇기에 YOLOv5와 YOLOv8이 640을 COCO 데이터셋에 대한 최적의 사이즈로 판단하고 모델을 학습시킨 게 아닌가 생각됩니다.
분석에 사용된 코드입니다.
import cv2
import numpy as np
import pathlib
import os
import matplotlib.pyplot as plt
from tqdm import tqdm
import concurrent.futures

root = 'C:/Users/yonghye/Documents/Workspace/datasets/coco/images'

def process_image(img_file):
    img_file = str(img_file)
    img = cv2.imread(img_file)
    h, w = img.shape[:2]
    return h, w

for split in ['train2017', 'val2017', 'test2017']:
    img_files = list(pathlib.Path(os.path.join(root, split)).rglob('*.jpg'))

    print("----------------")
    print(f'split: {split}')
    print(f'#images: {len(img_files)}')

    with concurrent.futures.ThreadPoolExecutor() as executor:
        results = list(tqdm(executor.map(process_image, img_files), total=len(img_files)))

    hs, ws = zip(*results)

    hs = np.array(hs)
    ws = np.array(ws)

    print(f'min h: {np.min(hs)}, max h: {np.max(hs)}, mean h: {np.mean(hs)}, median h: {np.median(hs)}')
    print(f'min w: {np.min(ws)}, max w: {np.max(ws)}, mean w: {np.mean(ws)}, median w: {np.median(ws)}')

    plt.figure()
    plt.hist(hs, bins=100)
    plt.title('height')
    plt.savefig(f'hist_{split}_h.png')

    plt.figure()
    plt.hist(ws, bins=100)
    plt.title('width')
    plt.savefig(f'hist_{split}_w.png')

    print("----------------")
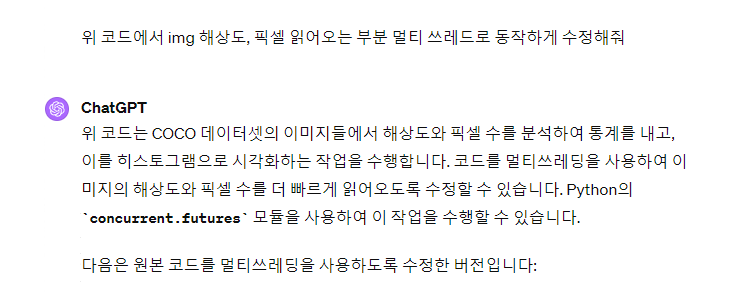
싱글쓰레드 기준으로 코드 구현한다음 챗지피티한테 멀티쓰레딩 기법 적용하여 구현해달라고 했습니다.
'Deep Learning' 카테고리의 다른 글
| META V-JEPA (1) | 2024.02.18 |
|---|---|
| Google Magika 파일 종류 인식을 AI로 (0) | 2024.02.18 |
| PCIe 5.0 지원 메인보드가 나왔구나 (1) | 2024.02.11 |
| YOLOv8 low-level output visualization code (0) | 2024.02.02 |
| Apple이 Vision Transformer 를 자사의 NPU에서 효율적으로 구동시키기 위해 시도한 것들 (0) | 2024.01.22 |
- Total
- Today
- Yesterday
- ㅂ
- PyCharm
- 인공지능을 위한 선형대수
- LCA
- 조합
- 자료구조
- 순열
- 백준 11437
- 위상 정렬 알고리즘
- FairMOT
- 백준 11053
- 백준 1766
- 이분탐색
- 가장 긴 증가하는 부분 수열
- C++ Deploy
- cosine
- MOT
- Lowest Common Ancestor
- 파이참
- 문제집
- 단축키
- 백트래킹
- 백준
| 일 | 월 | 화 | 수 | 목 | 금 | 토 |
|---|---|---|---|---|---|---|
| 1 | ||||||
| 2 | 3 | 4 | 5 | 6 | 7 | 8 |
| 9 | 10 | 11 | 12 | 13 | 14 | 15 |
| 16 | 17 | 18 | 19 | 20 | 21 | 22 |
| 23 | 24 | 25 | 26 | 27 | 28 | 29 |
| 30 | 31 |